・UAL reported $684M net income for 2Q18
・Flight attendant groups will integrate in October
・Fuel costs increased 43% ($2.4B YoY)
・United recovered 75% of increased fuel costs
United’s better-than-expected quarterly results
United Airlines parent company United Continental Holdings (UAL) beat analysts’ expectations and reported largely positive second-quarter results today. Phew!
Revenue increased 7.7% to $10.78B, although rising fuel costs led to a 16.7% decrease in net income. Other metrics like PRASM (passenger revenue per available seat mile), increased yield, and strong operational performance recovered 75% of increased fuel costs.
🌟 Check out View From the Wing for Gary’s take
Key metrics show strong results
↑ revenue 7.7% ($10.4B)
↓ net income 16.7% ($6.84M)
↑ passenger revenue in all regions except Latin America
↑ fuel costs 43% ($2.4B)
↑ passengers carried 7.3% (41M)
↑ load factor 1.3 pts (84.8%)
Takeaways from United’s Quarterly Earnings
Industry-leading operational performance
While it’s easy to criticize United’s customer experience, I must commend United for its strong operational performance. A key industry metric for on-time pushback from the gate is D:00, meaning the plane pushed back ‘0’ minutes after scheduled departure time.
United leads the industry at 70%, meaning 70% of flights leave exactly on-time. And check out Southwest: only 46% of flights (!!) pushed back at D:00.

U.S. Airline On-Time Pushback ‘D:00’ | Image: United
Overall passenger revenue (PRASM) is up 3%
🌟 PRASM = passenger revenue per available seat mile

UAL 2Q PRASM | Image: United

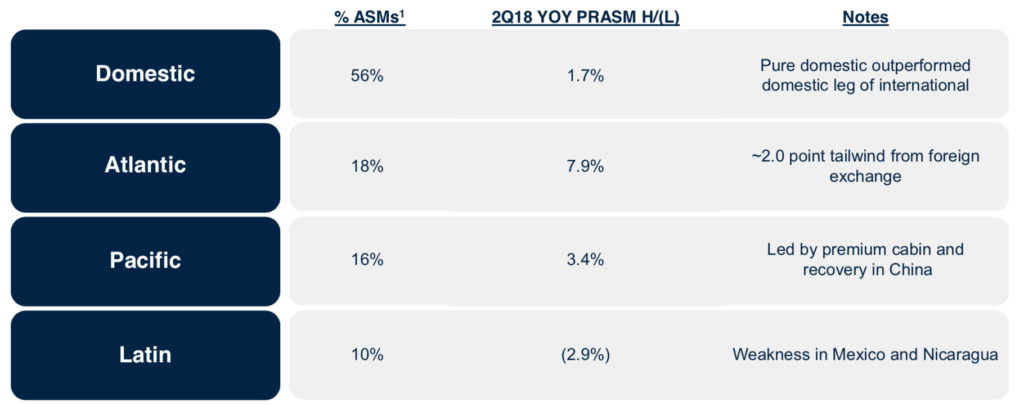
Overall PRASM Increased 3% | Image: United
- Domestic-only itineraries outperformed domestic flights feeding an international itinerary・
- United is starting to see premium cabin sales recover in Asia
- Weakness in Mexico and Nicaragua led to 2.9% decrease in PRASM
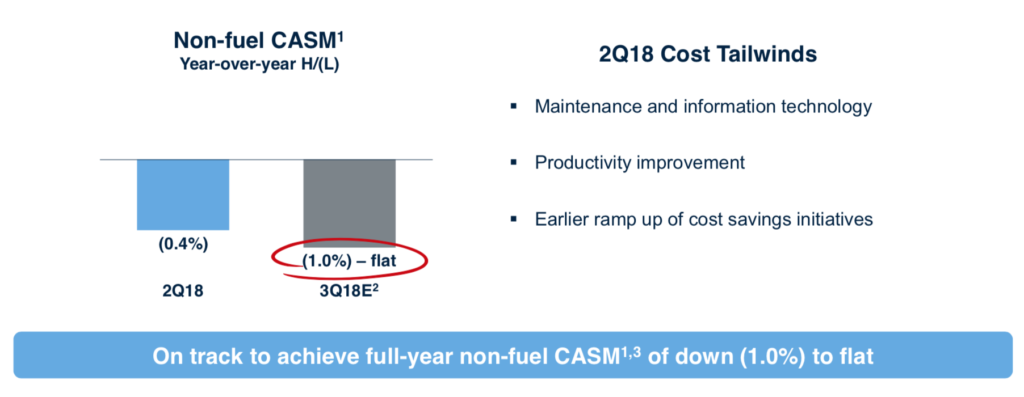
Non-fuel costs (CASM) are down 0.4%
🌟 CASM = cost per available seat miles
While United’s fuel costs spiked a whopping 43% (~$2.4B), its non-fuel CASM decreased thanks to a ‘ramp up of cost savings’ (translation: cost cutting). It’s worth noting Delta reported a similar 40% increase in fuel costs, so it’s not just United dealing with rising costs.

Non-fuel costs are down | Image: United
Almost half of United’s seats (ASMs) are international
🌟 ASM = available seat miles
ASM breakdown by region
- Domestic = 56%
- Atlantic = 18%
- Pacific = 16%
- Latin America = 10%
United Explorer card: sell, sell, sell…
YoY new acquisitions for the Explorer Card are up 10%
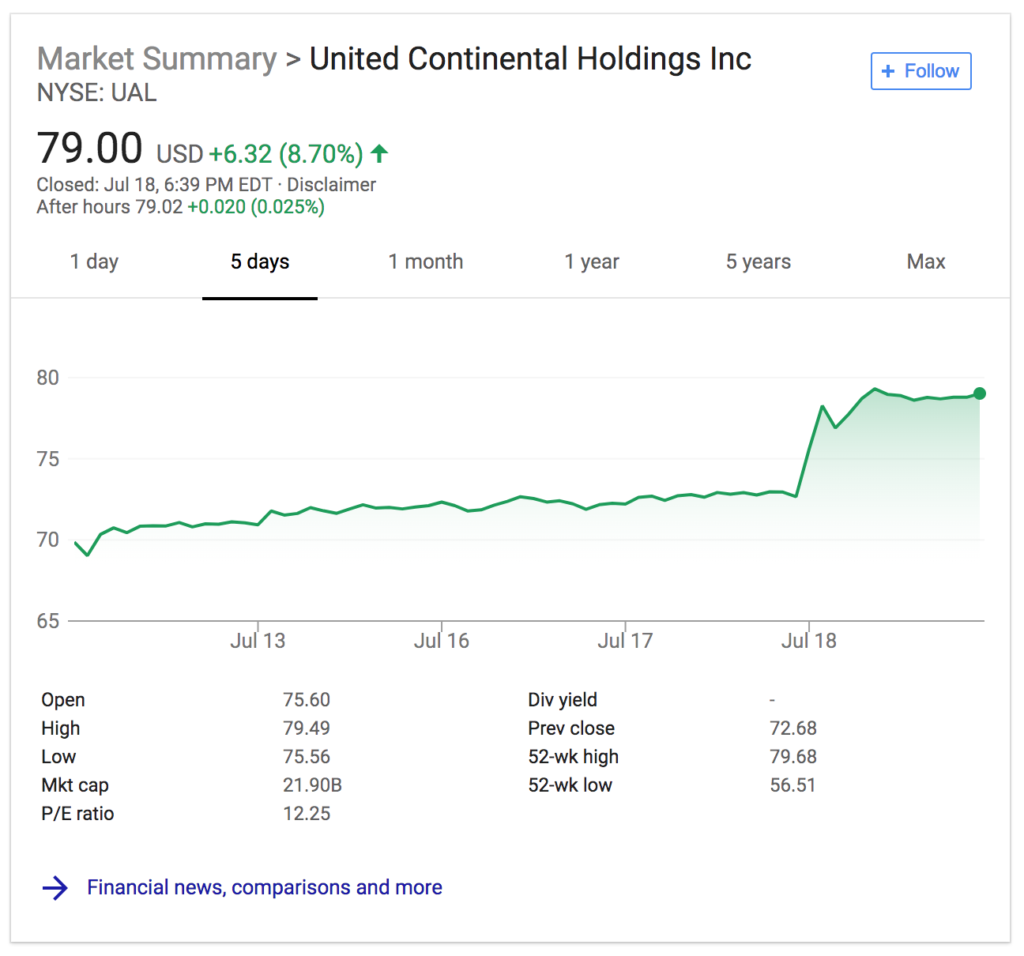
Investors and Wall Street are happy, at least over the last few days

UAL 5-Day Stock Price | Image: Google
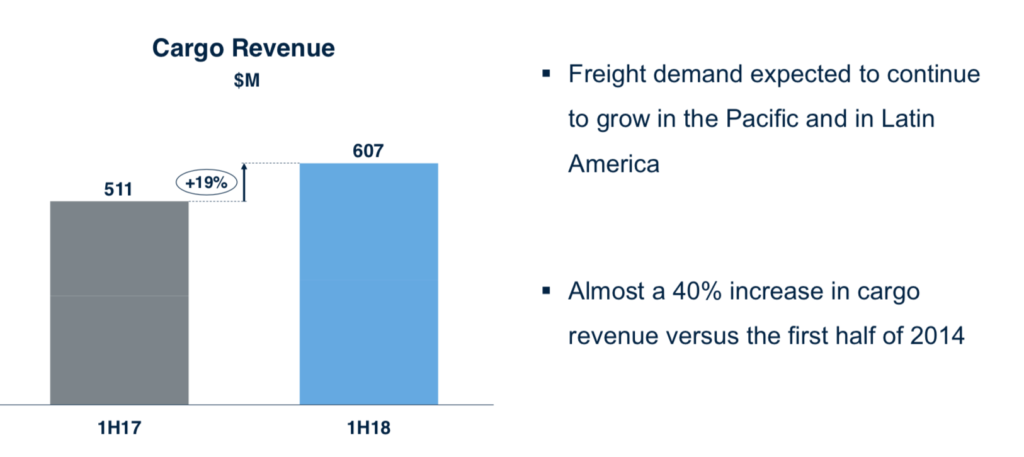
United’s cargo revenue is up 19%

United’s cargo performance | Image: United
Lastly… a new ‘favorite’ corporate jargon phrase
Ramp up of cost savings is a rather clever way of saying cutting costs.
H/T: View From the Wing
The responses below are not provided or commissioned by the bank advertiser. Responses have not been reviewed, approved or otherwise endorsed by the bank advertiser. It is not the bank advertiser's responsibility to ensure all posts and/or questions are answered.